Switzerland (Swiss Confederation), CH
Switzerland: Federal state in Western Europe
About

Quick Facts about Swiss Confederation
| Population : | 8,466,017 |
| Country : | Switzerland |
| Different from : | Switzerland County |
| Twitter username : | MySwitzerland_e, Suisse |
| Plate code : | CH |
| Area : | 41285 km2 |
| Official name : | Confédération suisse, Schweizerische Eidgenossenschaft, la Confédération suisse, Confederaziun svizra, Confederazione svizzera, Confoederatio Helvetica |
| Continent : | Europe |
| Easternmost point : | Point(10.49234033 46.6151637) |
| Northernmost point : | Point(8.57 47.8) |
| Legislative body : | Federal Assembly of Switzerland |
| Named for : | Schwyz |
| Official language : | German, Italian, French, Romansh |
| Capital : | Bern |
| Establishment : | January 01, 1970 (733 years ago) |
| Time Zone : | Europe/Zurich, Central European Time, UTC+02:00, UTC+01:00 |
| Local time : | 22:25:39 (7th June 2025) |


Geography
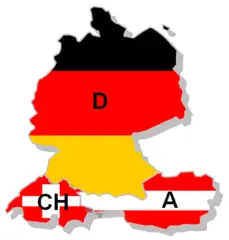
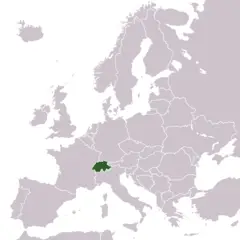
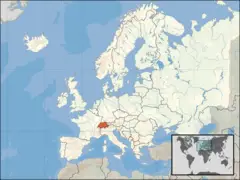
Swiss Confederation is located at 47°0'1"N 8°0'51"E (47.0001583752864, 8.01426887512207). It has 6 neighbors: Austria, Germany, France, Liechtenstein, Italy and Union.
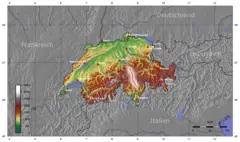
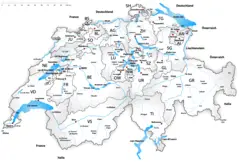
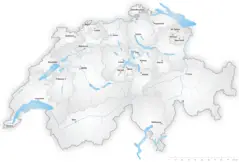
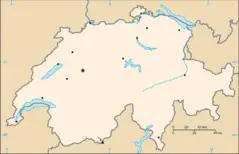
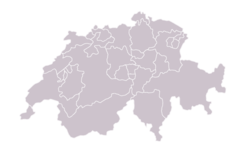
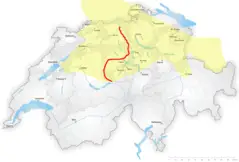
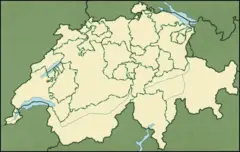
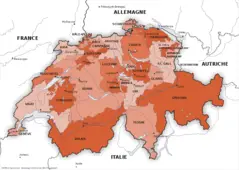
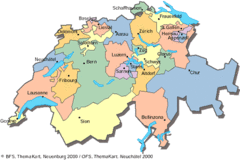
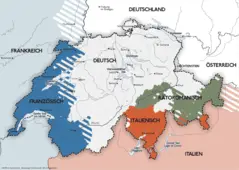
Switzerland map
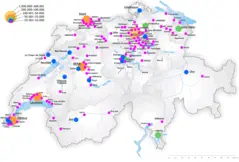
The largest city of Swiss Confederation is Genève with a population of 201,818. Other cities include, Basel population 177,636, Bern population 133,883, Winterthur population 111,840 and Luzern population 81,691. See all Swiss Confederation cities & populated places.
- Go to Official Website
- Go to Official Website
Official website of Swiss Confederation
Alain Berset ,
Swiss Confederation has 6 neighbours.
- Republic of Austria Independent country in Central Europe
- Federal Republic of Germany Independent country in Central Europe
- Republic of France Independent country with mainland in Western Europe and several overseas territories
- Principality of Liechtenstein Independent country in western-central Europe
- Italian Republic Independent country in southern Europe
- Union A city in Union County, New Jersey. It is located in the northeastern part of the county. Union is known for its many parks and green spaces, its many historical sites, and its many attractions, such as the Kean University campus and the Union City Historical Society.
- Canton of Zug
- Canton of Schaffhausen
- Schwyz
- Obwalden
- Canton of St. Gallen
- Canton of Jura
- Thurgau
- Basel-Stadt
- Uri
- Grisons
- Canton of Neuchâtel
- Nidwalden
- Appenzell Ausserrhoden
- Aargau
- Ticino
- Canton of Geneva
- Canton of Solothurn
- Appenzell Innerrhoden
- Canton of Lucerne
- Canton of Valais
- Canton of Zürich
- Basel-Landschaft
- Canton of Bern
- Canton of Vaud
- Glarus
- Canton of Fribourg
Demographics
| Year | Population | % Change | Method |
| 1960 | 5,327,827 | - | census |
| 1961 | 5,434,294 | 1.96% | census |
| 1962 | 5,573,815 | 2.5% | census |
| 1963 | 5,694,247 | 2.11% | census |
| 1964 | 5,789,228 | 1.64% | census |
| 1965 | 5,856,472 | 1.15% | census |
| 1966 | 5,918,002 | 1.04% | census |
| 1967 | 5,991,785 | 1.23% | census |
| 1968 | 6,067,714 | 1.25% | census |
| 1969 | 6,136,387 | 1.12% | census |
| 1970 | 6,180,877 | 0.72% | census |
| 1971 | 6,213,399 | 0.52% | census |
| 1972 | 6,260,956 | 0.76% | census |
| 1973 | 6,307,347 | 0.74% | census |
| 1974 | 6,341,405 | 0.54% | census |
| 1975 | 6,338,632 | -0.04% | census |
| 1976 | 6,302,504 | -0.57% | census |
| 1977 | 6,281,174 | -0.34% | census |
| 1978 | 6,281,738 | 0.01% | census |
| 1979 | 6,294,365 | 0.2% | census |
| 1980 | 6,319,408 | 0.4% | census |
| 1981 | 6,354,074 | 0.55% | census |
| 1982 | 6,391,309 | 0.58% | census |
| 1983 | 6,418,773 | 0.43% | census |
| 1984 | 6,441,865 | 0.36% | census |
| 1985 | 6,470,365 | 0.44% | census |
| 1986 | 6,504,124 | 0.52% | census |
| 1987 | 6,545,106 | 0.63% | census |
| 1988 | 6,593,386 | 0.73% | census |
| 1989 | 6,646,912 | 0.81% | census |
| 1990 | 6,715,519 | 1.02% | census |
| 1991 | 6,799,978 | 1.24% | census |
| 1992 | 6,875,364 | 1.1% | census |
| 1993 | 6,938,265 | 0.91% | census |
| 1994 | 6,993,795 | 0.79% | census |
| 1995 | 7,040,687 | 0.67% | census |
| 1996 | 7,071,850 | 0.44% | census |
| 1997 | 7,088,906 | 0.24% | census |
| 1998 | 7,110,001 | 0.3% | census |
| 1999 | 7,143,991 | 0.48% | census |
| 2000 | 7,184,250 | 0.56% | census |
| 2001 | 7,229,854 | 0.63% | census |
| 2002 | 7,284,753 | 0.75% | census |
| 2003 | 7,339,001 | 0.74% | census |
| 2004 | 7,389,625 | 0.69% | census |
| 2005 | 7,437,115 | 0.64% | census |
| 2006 | 7,483,934 | 0.63% | census |
| 2007 | 7,551,117 | 0.89% | census |
| 2008 | 7,647,675 | 1.26% | census |
| 2009 | 7,743,831 | 1.24% | census |
| 2010 | 7,824,909 | 1.04% | census |
| 2011 | 7,912,398 | 1.11% | census |
| 2012 | 7,996,861 | 1.06% | census |
| 2013 | 8,087,875 | 1.13% | census |
| 2014 | 8,211,700 | 1.51% | census |
| 2015 | 8,282,396 | 0.85% | (Worldbank) |
| 2016 | 8,373,338 | 1.09% | (Worldbank) |
| 2017 | 8,466,017 | 1.09% | census |
| 2018 | 8,514,329 | 0.57% | (Worldbank) |
| 2019 | 8,574,832 | 0.71% | (Worldbank) |
