Papua New Guinea (Independent State of Papua New Guinea), PG
Papua New Guinea: Island sovereign state in Oceania
About
Quick Facts about Independent State of Papua New Guinea
| Population : | 8,251,162 |
| Country : | Papua New Guinea |
| Different from : | Guinea |
| Head of government : | Prime Minister of Papua New Guinea |
| Plate code : | PNG |
| Area : | 462840 km2 |
| Official name : | Papua New Guinea, l’État indépendant de Papouasie- Nouvelle-Guinée |
| Continent : | Oceania |
| Easternmost point : | Point(159.4 -4.525) |
| Northernmost point : | Point(149.55 -1.32) |
| Legislative body : | National Parliament of Papua New Guinea |
| Official language : | Tok Pisin, Papua New Guinean Sign Language, Hiri Motu, English |
| Capital : | Port Moresby |
| Establishment : | January 01, 1975 (50 years ago) |
| Time Zone : | UTC+11:00, UTC+10:00 |
| Local time : | 21:57:35 (7th June 2025) |
Geography
Independent State of Papua New Guinea is located at 6°0'0"S 147°0'0"E (-6.0000000, 147.0000000). It has 2 neighbors: Indonesia and Australia.
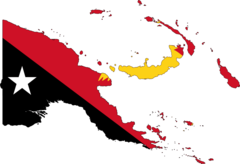
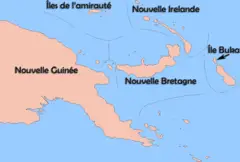
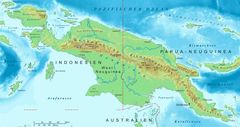
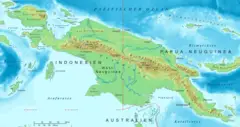
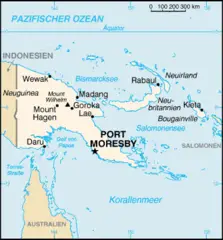
Papua New Guinea map
The largest city of Independent State of Papua New Guinea is Port Moresby with a population of 283,733. Other cities include, Lae population 76,255, Popondetta population 28,198, Kokopo population 26,273 and Wau population 14,629. See all Independent State of Papua New Guinea cities & populated places.
- Official Website
Official website of Independent State of Papua New Guinea
- Peter O'Neill , 29 May, 2019 2011-08-03T00:00:00Z
- James Marape , 2019-05-30T00:00:00Z
Independent State of Papua New Guinea has 2 neighbours.
- Republic of Indonesia Independent country in Southeast Asia situated on more than 17,000 islands
- Commonwealth of Australia island country in the Southern hemisphere
- Morobe Province
- Oro Province
- Manus Province
- East Sepik Province
- Jiwaka Province
- Enga Province
- Chimbu Province
- Autonomous Region of Bougainville
- West New Britain Province
- National Capital District
- Central Province
- Southern Highlands Province
- Western Province
- Gulf Province
- Western Highlands Province
- Madang Province
- Sandaun Province
- New Ireland Province
- East New Britain Province
- Milne Bay Province
- Hela Province
- Eastern Highlands Province
Demographics
| Year | Population | % Change | Method |
| 1960 | 1,966,957 | - | census |
| 1961 | 2,001,048 | 1.7% | census |
| 1962 | 2,037,164 | 1.77% | census |
| 1963 | 2,075,629 | 1.85% | census |
| 1964 | 2,116,831 | 1.95% | census |
| 1965 | 2,161,102 | 2.05% | census |
| 1966 | 2,208,421 | 2.14% | census |
| 1967 | 2,258,876 | 2.23% | census |
| 1968 | 2,313,016 | 2.34% | census |
| 1969 | 2,371,514 | 2.47% | census |
| 1970 | 2,434,754 | 2.6% | census |
| 1971 | 2,503,073 | 2.73% | census |
| 1972 | 2,576,093 | 2.83% | census |
| 1973 | 2,652,585 | 2.88% | census |
| 1974 | 2,730,859 | 2.87% | census |
| 1975 | 2,809,692 | 2.81% | census |
| 1976 | 2,888,510 | 2.73% | census |
| 1977 | 2,967,620 | 2.67% | census |
| 1978 | 3,047,769 | 2.63% | census |
| 1979 | 3,130,125 | 2.63% | census |
| 1980 | 3,215,483 | 2.65% | census |
| 1981 | 3,304,188 | 2.68% | census |
| 1982 | 3,395,798 | 2.7% | census |
| 1983 | 3,489,402 | 2.68% | census |
| 1984 | 3,583,707 | 2.63% | census |
| 1985 | 3,677,854 | 2.56% | census |
| 1986 | 3,771,592 | 2.49% | census |
| 1987 | 3,865,448 | 2.43% | census |
| 1988 | 3,960,314 | 2.4% | census |
| 1989 | 4,057,467 | 2.39% | census |
| 1990 | 4,157,903 | 2.42% | census |
| 1991 | 4,261,797 | 2.44% | census |
| 1992 | 4,369,087 | 2.46% | census |
| 1993 | 4,480,243 | 2.48% | census |
| 1994 | 4,595,761 | 2.51% | census |
| 1995 | 4,715,929 | 2.55% | census |
| 1996 | 4,841,020 | 2.58% | census |
| 1997 | 4,970,823 | 2.61% | census |
| 1998 | 5,104,516 | 2.62% | census |
| 1999 | 5,240,941 | 2.6% | census |
| 2000 | 5,379,226 | 2.57% | census |
| 2001 | 5,518,971 | 2.53% | census |
| 2002 | 5,660,267 | 2.5% | census |
| 2003 | 5,803,302 | 2.46% | census |
| 2004 | 5,948,461 | 2.44% | census |
| 2005 | 6,095,959 | 2.42% | census |
| 2006 | 6,245,797 | 2.4% | census |
| 2007 | 6,397,623 | 2.37% | census |
| 2008 | 6,550,877 | 2.34% | census |
| 2009 | 6,704,829 | 2.3% | census |
| 2010 | 6,858,945 | 2.25% | census |
| 2011 | 7,012,977 | 2.2% | census |
| 2012 | 7,167,010 | 2.15% | census |
| 2013 | 7,321,262 | 2.11% | census |
| 2014 | 7,946,731 | 7.87% | (Worldbank) |
| 2015 | 8,107,775 | 1.99% | (Worldbank) |
| 2016 | 8,271,760 | 1.98% | (Worldbank) |
| 2017 | 8,251,162 | -0.25% | census |
| 2018 | 8,606,316 | 4.13% | (Worldbank) |
| 2019 | 8,776,109 | 1.93% | (Worldbank) |

