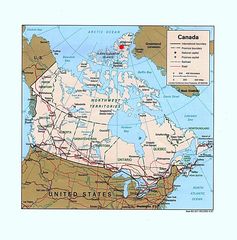
Canada, CA
Canada: Independent country in North America
About

Quick Facts about Canada
| Population : | 36,708,083 |
| Country : | Canada |
| Head of government : | Prime Minister of Canada |
| Twitter username : | Canada, AuCanada |
| Plate code : | CDN |
| Area : | 9984670 km2 |
| Official name : | Canada, Canada, le Canada |
| Water as percent of area : | 8.62% |
| Land as percent of area : | 91.38% |
| Continent : | North America |
| Easternmost point : | Point(-52.619444444 47.523611111) |
| Northernmost point : | Point(-69.958333333 83.111388888) |
| Patron saint : | Jean de Brébeuf, North American Martyrs, Saint Anne, Joseph |
| Legislative body : | Parliament of Canada |
| Named for : | Stadacona |
| Official language : | French, English |
| Capital : | Ottawa |
| Establishment : | July 07, 1867 (157 years ago) |
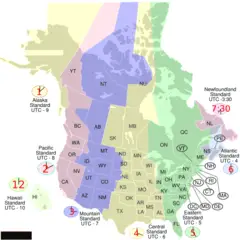
| Time Zone : | Mountain Time Zone, Newfoundland Time Zone, UTC−05:00, UTC−07:00, Atlantic Time Zone, Pacific Time Zone, UTC−06:00, UTC−04:00, Eastern Time Zone, Central Time Zone |
| Local time : | 06:30:50 (9th June 2025) |


Geography
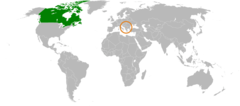
Canada is located at 60°0'0"N 96°0'0"W (60.0, -96.0). It has 4 neighbors: Saint Pierre and Miquelon, Greenland, Prince Edward Island and United States.
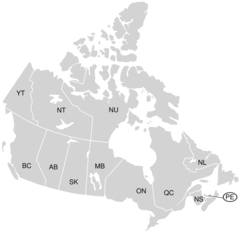
Canada map
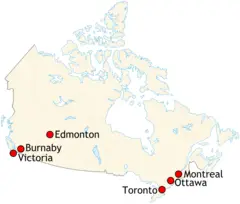
The largest city of Canada is Calgary with a population of 1,239,220. Other cities include, Ottawa population 812,129, Hamilton population 536,917, Etobicoke population 347,948 and Oshawa population 308,875. See all Canada cities & populated places.
- Official Website
Official website of Canada
- Justin Trudeau , 2015-11-04T00:00:00Z
- John A. Macdonald , 5 November, 1873 1867-07-01T00:00:00Z
- Alexander Mackenzie , 8 October, 1878 1873-11-07T00:00:00Z
- William Lyon Mackenzie King , 7 August, 1930 1926-09-25T00:00:00Z
- Stephen Harper , 3 November, 2015 2006-02-06T00:00:00Z
- William Lyon Mackenzie King , 15 November, 1948 1935-10-23T00:00:00Z
- William Lyon Mackenzie King , 1921-12-29T00:00:00Z 28 June, 1926
Canada has 4 neighbours.
- Saint Pierre and Miquelon self-governing territorial overseas collectivity of France
- Greenland autonomous country within the Kingdom of Denmark
- Prince Edward Island province of Canada
- United States Independent country in North America
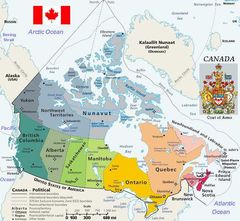
- Prince Edward Island
- Manitoba
- Northwest Territories
- Saskatchewan
- British Columbia
- Yukon
- Alberta
- Nunavut
- District of Keewatin
- Newfoundland and Labrador
- Ontario
- Quebec
- New Brunswick
- Nova Scotia
Demographics
| Year | Population | % Change | Method |
| 1605 | 44 | - | estimation process |
| 1608 | 28 | -57.14% | estimation process |
| 1620 | 602 | 95.35% | estimation process |
| 1622 | 32 | -1781.25% | estimation process |
| 1628 | 76 | 57.89% | estimation process |
| 1629 | 117 | 35.04% | estimation process |
| 1641 | 240 | 51.25% | estimation process |
| 1663 | 2,500 | 90.4% | estimation process |
| 1666 | 3,215 | 22.24% | 1665-01-01T00:00:00Z |
| 1667 | 3,918 | 17.94% | estimation process |
| 1668 | 6,282 | 37.63% | estimation process |
| 1671 | 514 | -1122.18% | estimation process |
| 1673 | 6,768 | 92.41% | estimation process |
| 1675 | 7,832 | 13.59% | estimation process |
| 1676 | 8,415 | 6.93% | estimation process |
| 1680 | 10,679 | 21.2% | estimation process |
| 1681 | 9,677 | -10.35% | estimation process |
| 1683 | 10,251 | 5.6% | estimation process |
| 1685 | 12,263 | 16.41% | estimation process |
| 1686 | 13,258 | 7.5% | estimation process |
| 1687 | 663 | -1899.7% | estimation process |
| 1691 | 155 | -327.74% | estimation process |
| 1693 | 1,009 | 84.64% | estimation process |
| 1695 | 13,688 | 92.63% | estimation process |
| 1698 | 17,832 | 23.24% | estimation process |
| 1701 | 1,134 | -1472.49% | estimation process |
| 1705 | 520 | -118.08% | estimation process |
| 1706 | 16,417 | 96.83% | estimation process |
| 1707 | 18,688 | 12.15% | estimation process |
| 1711 | 225 | -8205.78% | estimation process |
| 1712 | 18,440 | 98.78% | estimation process |
| 1713 | 18,119 | -1.77% | estimation process |
| 1714 | 20,737 | 12.62% | estimation process |
| 1718 | 22,983 | 9.77% | estimation process |
| 1719 | 22,530 | -2.01% | estimation process |
| 1720 | 24,534 | 8.17% | estimation process |
| 1721 | 24,951 | 1.67% | estimation process |
| 1722 | 25,053 | 0.41% | estimation process |
| 1723 | 26,479 | 5.39% | estimation process |
| 1726 | 29,396 | 9.92% | estimation process |
| 1728 | 330 | -8807.88% | estimation process |
| 1730 | 33,682 | 99.02% | estimation process |
| 1731 | 6,000 | -461.37% | estimation process |
| 1732 | 35,164 | 82.94% | estimation process |
| 1734 | 37,716 | 6.77% | estimation process |
| 1735 | 541 | -6871.53% | estimation process |
| 1736 | 39,063 | 98.62% | estimation process |
| 1739 | 42,817 | 8.77% | estimation process |
| 1753 | 13,000 | -229.36% | estimation process |
| 1760 | 70,000 | 81.43% | estimation process |
| 1763 | 78,880 | 11.26% | estimation process |
| 1764 | 12,998 | -506.86% | estimation process |
| 1765 | 89,749 | 85.52% | estimation process |
| 1767 | 11,779 | -661.94% | estimation process |
| 1771 | 8,442 | -39.53% | estimation process |
| 1772 | 19,985 | 57.76% | estimation process |
| 1775 | 90,000 | 77.79% | estimation process |
| 1781 | 12,000 | -650% | estimation process |
| 1784 | 166,012 | 92.77% | estimation process |
| 1785 | 10,244 | -1520.58% | estimation process |
| 1790 | 191,311 | 94.65% | estimation process |
| 1793 | 2,000 | -9465.55% | 1653-01-01T00:00:00Z |
| 1797 | 4,500 | 55.56% | estimation process |
| 1811 | 77,000 | 94.16% | estimation process |
| 1816 | 52,672 | -46.19% | estimation process |
| 1826 | 166,379 | 68.34% | estimation process |
| 1828 | 246,576 | 32.52% | estimation process |
| 1829 | 197,815 | -24.65% | estimation process |
| 1831 | 792,226 | 75.03% | estimation process |
| 1832 | 322,834 | -145.4% | estimation process |
| 1835 | 351,008 | 8.03% | estimation process |
| 1836 | 447,804 | 21.62% | estimation process |
| 1837 | 597,395 | 25.04% | estimation process |
| 1838 | 605,963 | 1.41% | estimation process |
| 1839 | 409,048 | -48.14% | estimation process |
| 1840 | 593,025 | 31.02% | estimation process |
| 1841 | 502,730 | -17.96% | estimation process |
| 1842 | 487,053 | -3.22% | estimation process |
| 1843 | 5,143 | -9370.21% | estimation process |
| 1845 | 96,295 | 94.66% | estimation process |
| 1857 | 122,638 | 21.48% | estimation process |
| 1861 | 3,229,633 | 96.2% | census |
| 1867 | 3,463,000 | 6.74% | estimation process |
| 1868 | 3,511,000 | 1.37% | estimation process |
| 1870 | 3,625,000 | 3.14% | estimation process |
| 1871 | 3,689,257 | 1.74% | census |
| 1872 | 3,754,000 | 1.72% | estimation process |
| 1873 | 3,826,000 | 1.88% | estimation process |
| 1875 | 3,954,000 | 3.24% | estimation process |
| 1876 | 4,009,000 | 1.37% | estimation process |
| 1878 | 4,120,000 | 2.69% | estimation process |
| 1879 | 4,185,000 | 1.55% | estimation process |
| 1881 | 4,325,000 | 3.24% | estimation process |
| 1882 | 4,375,000 | 1.14% | estimation process |
| 1883 | 4,430,000 | 1.24% | estimation process |
| 1884 | 4,487,000 | 1.27% | estimation process |
| 1885 | 4,537,000 | 1.1% | estimation process |
| 1886 | 4,580,000 | 0.94% | estimation process |
| 1887 | 4,626,000 | 0.99% | estimation process |
| 1888 | 4,678,000 | 1.11% | estimation process |
| 1890 | 4,779,000 | 2.11% | estimation process |
| 1891 | 4,833,239 | 1.12% | census |
| 1892 | 4,883,000 | 1.02% | estimation process |
| 1895 | 5,026,000 | 2.85% | estimation process |
| 1896 | 5,074,000 | 0.95% | estimation process |
| 1897 | 5,122,000 | 0.94% | estimation process |
| 1898 | 5,175,000 | 1.02% | estimation process |
| 1900 | 5,301,000 | 2.38% | estimation process |
| 1901 | 5,371,315 | 1.31% | census |
| 1902 | 5,494,000 | 2.23% | estimation process |
| 1904 | 5,827,000 | 5.71% | estimation process |
| 1905 | 6,002,000 | 2.92% | estimation process |
| 1906 | 6,097,000 | 1.56% | estimation process |
| 1907 | 6,411,000 | 4.9% | estimation process |
| 1909 | 6,800,000 | 5.72% | estimation process |
| 1911 | 7,207,000 | 5.65% | estimation process |
| 1912 | 7,389,000 | 2.46% | estimation process |
| 1913 | 7,632,000 | 3.18% | estimation process |
| 1914 | 7,879,000 | 3.13% | estimation process |
| 1916 | 8,001,000 | 1.52% | estimation process |
| 1917 | 8,060,000 | 0.73% | estimation process |
| 1918 | 8,148,000 | 1.08% | estimation process |
| 1919 | 8,311,000 | 1.96% | estimation process |
| 1920 | 8,556,000 | 2.86% | estimation process |
| 1921 | 8,787,949 | 2.64% | census |
| 1922 | 8,919,000 | 1.47% | estimation process |
| 1924 | 9,143,000 | 2.45% | estimation process |
| 1925 | 9,294,000 | 1.62% | estimation process |
| 1927 | 9,637,000 | 3.56% | estimation process |
| 1928 | 9,835,000 | 2.01% | estimation process |
| 1929 | 10,029,000 | 1.93% | estimation process |
| 1930 | 10,208,000 | 1.75% | estimation process |
| 1931 | 10,376,786 | 1.63% | census |
| 1933 | 10,633,000 | 2.41% | estimation process |
| 1934 | 10,741,000 | 1.01% | estimation process |
| 1936 | 10,950,000 | 1.91% | estimation process |
| 1937 | 11,045,000 | 0.86% | estimation process |
| 1939 | 11,267,000 | 1.97% | estimation process |
| 1940 | 11,381,000 | 1% | estimation process |
| 1941 | 11,507,000 | 1.09% | estimation process |
| 1942 | 11,654,000 | 1.26% | estimation process |
| 1943 | 11,795,000 | 1.2% | estimation process |
| 1944 | 11,946,000 | 1.26% | estimation process |
| 1945 | 12,072,000 | 1.04% | estimation process |
| 1946 | 12,292,000 | 1.79% | estimation process |
| 1947 | 12,551,000 | 2.06% | estimation process |
| 1948 | 12,823,000 | 2.12% | estimation process |
| 1949 | 13,447,000 | 4.64% | estimation process |
| 1950 | 13,712,000 | 1.93% | estimation process |
| 1951 | 14,009,000 | 2.12% | estimation process |
| 1952 | 14,459,000 | 3.11% | estimation process |
| 1953 | 14,845,000 | 2.6% | estimation process |
| 1955 | 15,698,000 | 5.43% | estimation process |
| 1956 | 16,081,000 | 2.38% | estimation process |
| 1957 | 16,610,000 | 3.18% | estimation process |
| 1958 | 17,080,000 | 2.75% | estimation process |
| 1959 | 17,483,000 | 2.31% | estimation process |
| 1960 | 17,909,009 | 2.38% | estimation process |
| 1961 | 18,238,000 | 1.8% | estimation process |
| 1962 | 18,614,000 | 2.02% | estimation process |
| 1963 | 18,964,000 | 1.85% | estimation process |
| 1964 | 19,325,000 | 1.87% | estimation process |
| 1965 | 19,678,000 | 1.79% | estimation process |
| 1966 | 20,015,000 | 1.68% | estimation process |
| 1967 | 20,412,000 | 1.94% | estimation process |
| 1968 | 20,701,000 | 1.4% | estimation process |
| 1969 | 21,001,000 | 1.43% | estimation process |
| 1970 | 21,324,000 | 1.51% | estimation process |
| 1971 | 21,961,999 | 2.91% | estimation process |
| 1972 | 21,993,631 | 0.14% | 1823-01-01T00:00:00Z |
| 1973 | 22,491,757 | 2.21% | estimation process |
| 1974 | 22,807,918 | 1.39% | estimation process |
| 1975 | 23,143,192 | 1.45% | estimation process |
| 1976 | 23,449,791 | 1.31% | estimation process |
| 1977 | 23,796,000 | 1.45% | estimation process |
| 1978 | 23,963,370 | 0.7% | estimation process |
| 1979 | 24,277,000 | 1.29% | estimation process |
| 1980 | 24,516,071 | 0.98% | estimation process |
| 1981 | 24,900,000 | 1.54% | estimation process |
| 1982 | 25,202,000 | 1.2% | estimation process |
| 1983 | 25,456,000 | 1% | estimation process |
| 1984 | 25,607,651 | 0.59% | estimation process |
| 1985 | 25,842,736 | 0.91% | estimation process |
| 1986 | 26,204,000 | 1.38% | estimation process |
| 1987 | 26,550,000 | 1.3% | estimation process |
| 1988 | 26,895,000 | 1.28% | estimation process |
| 1989 | 27,281,795 | 1.42% | estimation process |
| 1990 | 27,791,000 | 1.83% | estimation process |
| 1991 | 28,171,682 | 1.35% | estimation process |
| 1992 | 28,519,597 | 1.22% | 1935-01-01T00:00:00Z |
| 1993 | 28,833,410 | 1.09% | 1990-01-01T00:00:00Z |
| 1994 | 28,999,006 | 0.57% | estimation process |
| 1995 | 29,302,091 | 1.03% | estimation process |
| 1996 | 29,671,900 | 1.25% | estimation process |
| 1997 | 29,987,200 | 1.05% | 1724-01-01T00:00:00Z |
| 1998 | 30,247,900 | 0.86% | estimation process |
| 1999 | 30,499,200 | 0.82% | estimation process |
| 2000 | 30,769,700 | 0.88% | estimation process |
| 2001 | 31,021,251 | 0.81% | estimation process |
| 2002 | 31,362,000 | 1.09% | estimation process |
| 2003 | 31,676,077 | 0.99% | estimation process |
| 2004 | 31,989,454 | 0.98% | estimation process |
| 2005 | 32,299,496 | 0.96% | estimation process |
| 2006 | 32,623,490 | 0.99% | estimation process |
| 2007 | 32,887,928 | 0.8% | estimation process |
| 2008 | 33,245,773 | 1.08% | estimation process |
| 2009 | 33,628,571 | 1.14% | estimation process |
| 2010 | 34,005,274 | 1.11% | estimation process |
| 2011 | 34,342,780 | 0.98% | estimation process |
| 2012 | 34,752,128 | 1.18% | estimation process |
| 2013 | 35,154,279 | 1.14% | estimation process |
| 2014 | 35,437,435 | 0.8% | (Worldbank) |
| 2015 | 35,702,707 | 0.74% | estimation process |
| 2016 | 36,155,487 | 1.25% | 1987-01-01T00:00:00Z |
| 2017 | 36,708,083 | 1.51% | 1962-01-01T00:00:00Z |
| 2018 | 37,057,765 | 0.94% | (Worldbank) |
| 2019 | 37,589,262 | 1.41% | (Worldbank) |
Ca-na-da, Ca-na-đa, Canada, Canada (Gia Na GJại), Canada (Gia Nã Đại), Canadà, Canadá, Ceanada, Kanada, Kanado, Kanadá, Kanata, Kanáda, Kanāda, Kānata, Καναδάς, Канада, Կանադա, קנדה, كندا, کانادا, کاناډا, کینیڈا, कनाडा, கனடா, കനഡ, แคนาดา, ການາດາ, ཀེ་ན་ཌ, ཁེ་ན་ཌ།, კანადა, ካናዳ, កាណាដា, カナダ, 加拿大, 캐나다


.png)



.png)
