Algeria (People’s Democratic Republic of Algeria), DZ
Algeria: Sovereign in North Africa
About

Quick Facts about People’s Democratic Republic of Algeria
| Population : | 41,318,142 |
| Country : | Algeria |
| Head of government : | Prime Minister of Algeria |
| Plate code : | DZ |
| Area : | 2381741 km2 |
| Official name : | الجمهورية الجزائرية الديمقراطية الشعبية, la République algérienne démocratique populaire |
| Continent : | Africa |
| Easternmost point : | Point(11.99999811 23.49999976) |
| Northernmost point : | Point(7.22 37.08), Point(7.20329 37.09503) |
| Legislative body : | Parliament of Algeria |
| Official language : | Arabic, Standard Algerian Berber |
| Capital : | Algiers |
| Time Zone : | UTC+01:00 |
| Local time : | 13:30:25 (7th June 2025) |


Geography
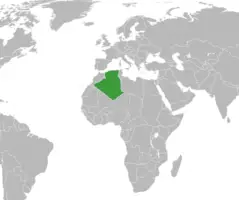
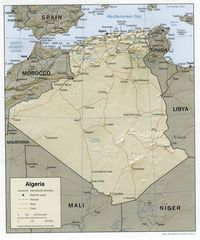
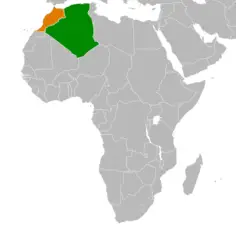
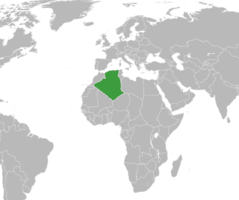
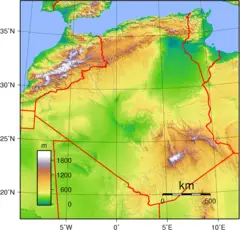
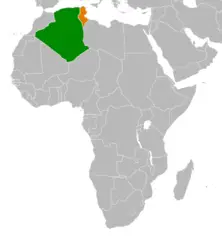
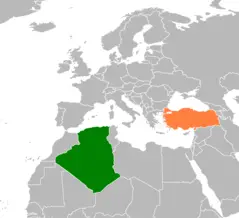
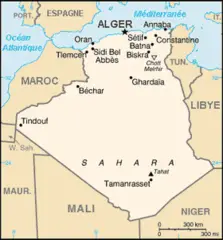
People’s Democratic Republic of Algeria is located at 28°0'0"N 3°0'0"E (28.0000000, 3.0000000). It has 6 neighbors: Mauritania, Niger, Mali, Western Sahara, Tunisia and Morocco.
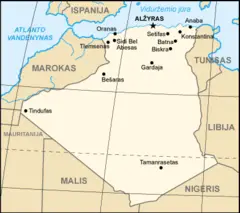
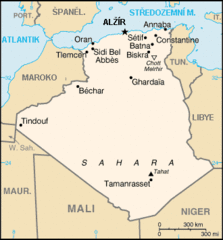
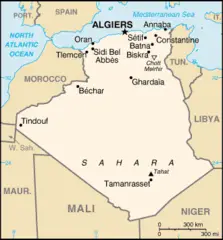
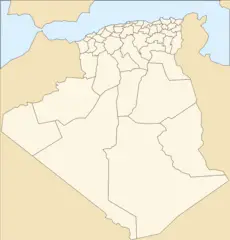
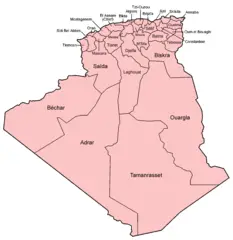
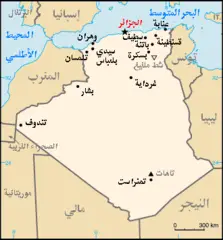
Algeria map
The largest city of People’s Democratic Republic of Algeria is Algiers with a population of 3,415,811. Other cities include, Oran population 645,984, Constantine population 450,097, Mansoûra population 439,348 and Sidi Bel Abbès population 191,769. See all People’s Democratic Republic of Algeria cities & populated places.
- Abdelaziz Djerrad , 2019-12-28T00:00:00Z
- Ahmed Ouyahia , 12 March, 2019 2017-08-16T00:00:00Z
- Noureddine Bedoui , 19 December, 2019 2019-03-11T00:00:00Z
- Abdelmadjid Tebboune , 15 August, 2017 2017-05-25T00:00:00Z
People’s Democratic Republic of Algeria has 6 neighbours.
- Islamic Republic of Mauritania Independent country in Africa
- Republic of Niger Independent country in Western Africa
- Republic of Mali Independent country in West Africa
- Western Sahara disputed territory in the Maghreb region of North Africa
- Republic of Tunisia Independent country in Northern Africa
- Kingdom of Morocco Independent country in North Africa
- Souk Ahras Province
- Béjaïa Province
- Naama Province
- Tipasa Province
- Tlemcen Province
- Skikda Province
- Béchar Province
- Mascara Province
- El Tarf Province
- Annaba Province
- Tébessa Province
- Mila Province
- Relizane Province
- El Oued Province
- Bordj Bou Arréridj Province
- El Bayadh Province
- Tizi Ouzou Province
- Ghardaïa Province
- Illizi Province
- Aïn Defla Province
- Oran Province
- Boumerdès Province
- Guezzam Province
- In Salah Province
- Touggourt Province
- Timimoun Province
- Beni Abbes Province
- Bordj Baji Mokhtar Province
- Ouled Djellal Province
- El Meniaa Province
- El M'Ghair Province
- Djanet Province
- Aïn Témouchent Province
- Tindouf Province
- Bouïra Province
- Guelma Province
- Adrar Province
- Batna Province
- Khenchela Province
- Chlef Province
- Blida Province
- Médéa Province
- Biskra Province
- M'Sila Province
- Saïda Province
- Tamanghasset Province
- Algiers Province
- Tiaret Province
- Tissemsilt Province
- Sétif Province
- Mostaganem Province
- Ouargla Province
- Oum El Bouaghi Province
- Sidi Bel Abbès Province
- Jijel Province
- Laghouat Province
- Djelfa Province
- Constantine Province
Demographics
| Year | Population | % Change | Method |
| 1960 | 11,057,863 | - | |
| 1961 | 11,336,339 | 2.46% | |
| 1962 | 11,619,828 | 2.44% | |
| 1963 | 11,912,803 | 2.46% | |
| 1964 | 12,221,675 | 2.53% | |
| 1965 | 12,550,885 | 2.62% | |
| 1966 | 12,902,627 | 2.73% | |
| 1967 | 13,275,026 | 2.81% | |
| 1968 | 13,663,583 | 2.84% | |
| 1969 | 14,061,722 | 2.83% | |
| 1970 | 14,464,985 | 2.79% | |
| 1971 | 14,872,250 | 2.74% | |
| 1972 | 15,285,990 | 2.71% | |
| 1973 | 15,709,825 | 2.7% | |
| 1974 | 16,149,025 | 2.72% | |
| 1975 | 16,607,707 | 2.76% | |
| 1976 | 17,085,801 | 2.8% | |
| 1977 | 17,582,904 | 2.83% | |
| 1978 | 18,102,266 | 2.87% | |
| 1979 | 18,647,815 | 2.93% | |
| 1980 | 19,221,665 | 2.99% | |
| 1981 | 19,824,301 | 3.04% | |
| 1982 | 20,452,902 | 3.07% | |
| 1983 | 21,101,875 | 3.08% | |
| 1984 | 21,763,575 | 3.04% | |
| 1985 | 22,431,502 | 2.98% | |
| 1986 | 23,102,389 | 2.9% | |
| 1987 | 23,774,284 | 2.83% | |
| 1988 | 24,443,467 | 2.74% | |
| 1989 | 25,106,190 | 2.64% | |
| 1990 | 25,758,869 | 2.53% | |
| 1991 | 26,400,479 | 2.43% | |
| 1992 | 27,028,326 | 2.32% | |
| 1993 | 27,635,515 | 2.2% | |
| 1994 | 28,213,774 | 2.05% | |
| 1995 | 28,757,785 | 1.89% | |
| 1996 | 29,266,405 | 1.74% | |
| 1997 | 29,742,979 | 1.6% | |
| 1998 | 30,192,754 | 1.49% | |
| 1999 | 30,623,406 | 1.41% | |
| 2000 | 31,042,235 | 1.35% | |
| 2001 | 31,451,514 | 1.3% | |
| 2002 | 31,855,109 | 1.27% | |
| 2003 | 32,264,157 | 1.27% | |
| 2004 | 32,692,163 | 1.31% | |
| 2005 | 33,149,724 | 1.38% | |
| 2006 | 33,641,002 | 1.46% | |
| 2007 | 34,166,972 | 1.54% | |
| 2008 | 34,730,608 | 1.62% | |
| 2009 | 35,333,881 | 1.71% | |
| 2010 | 35,977,455 | 1.79% | |
| 2011 | 36,661,444 | 1.87% | |
| 2012 | 37,383,887 | 1.93% | |
| 2013 | 38,140,132 | 1.98% | |
| 2014 | 38,923,687 | 2.01% | |
| 2015 | 39,728,025 | 2.02% | |
| 2016 | 40,551,404 | 2.03% | |
| 2017 | 41,389,198 | 2.02% | |
| 2018 | 42,228,429 | 1.99% | |
| 2019 | 43,053,054 | 1.92% |
'Aisilia, 'Alekelia, Aildiria, Al Jaza'ir, Al Jazā’ir, Al Jumhuriyah al Jaza'iriyah ad Dimuqratiyah ash Sha`biyah, Al Jumhūrīyah al Jazā’irīyah ad Dīmuqrāţīyah ash Sha‘bīyah, AlIeeria, Alaseri, Alcheria, Aldjereye, Algeria, Algeria nutome, Algerie, Algerien, Algeriet, Algerija, Algerije, Algerio, Algeriska, Algerium, Algerië, Algerìa, Algieria, Algiria, Algirìa, Algjeri, Algjeria, Alg·èrie, Algèria, Algéria, Algérie, Alhirya, Aligerya, Alijeri, Alijeriya, Alizeri, Alizɛri, Aljazair, Aljeeriya, Aljeri, Aljeria, Aljeriya, Alseeri, Alsir, Alsír, Alxeria, Alzeeria, Alzeria, Alzerii, Alzerïi, Alzhir, Alzhyr, Alzir, Alziria, Alzirija, Alzirsko, Alzyras, Alĝerio, Alġerija, AlĪeeria, Alžeeria, Alžir, Alžirija, Alžyras, Alžírsko, Alžīrija, An Ailgeir, An Ailgéir, An-ghe-ri (Algeria), An-ghê-ri (Algeria), An-gie-ri, An-giê-ri, Ardjiriya, Argelia, Argeria, Argélia, Arhelya, Arjelia, Arxelia, Cezayir, Cezayır, Democratic People's Republic of Algeria, Democratic People’s Republic of Algeria, Democratic and Popular Republic of Algeria, L'Algerie, L'Etat Algerien, La Republique Algerienne, La Republique Algerienne Democratique et Populaire, La République Algérienne, La République Algérienne Démocratique et Populaire, L’Algérie, L’Etat Algerien, Orileede Alugeriani, Orílẹ́ède Àlùgèríánì, People's Democratic Republic of Algeria, People’s Democratic Republic of Algeria, Republic of Algeria, Republica d'Algeria, Republique Algerienne Democratique et Populaire, República d'Algèria, République Algérienne Démocratique et Populaire, a er ji li ya, alajeri'a, alajeriya, algeriya, aljeli, aljeriya, aljiriya, aljyrya, aljzayr, aljzyrh, alzhiri, arujeria, arujeria min zhu ren min gong he guo, elajiriya, i-Algeria, Ɔlgyeria, Əlcəzair, ʻAisilia, ʼlgyryh, Αλγερία, Алжир, Алжирія, Алжыр, Алҷазоир, Ալժիր, אלגיריה, אלגריה, אלג׳יריה, אלזשיר, ئالجىرىيە, ئەلجەزایر, الجزائر, الجزاير, الجزایر, الجزیره, الجمهورية الجزائرية الديمقراطية الشعبية, الجیریا, ޖަޒާއިރު, अल्जीरिया, अल्जेरिया, আলজেরিয়া, এলজিরিয়া, અલ્જીરિયા, ଆଲଜେରିଆ, அல்ஜீரியா, అల్జీరియా, ಅಲ್ಗೇರಿಯಾ, അള്ജീരിയ, ඇල්ජීරියාව, ประเทศแอลจีเรีย, แอลจีเรีย, ແອລຈິເລຍ, ཨལ་ཇི་རི་ཡ།, အယ်လ်ဂျီးရီးယား, ალჟირი, አልጄሪያ, បរទេសអាលហសេរ, ប្រទេសអាល់ហ្សេរី, អាល់ហ្សេរី, ‘Alekelia, アルジェリア, アルジェリア民主人民共和国, 阿尔及利亚, 알제리
